
This post will walk you through the steps needed to capture the incoming/outgoing traffic on Tier0 gateway uplink level. The result will be a PCAP file that can be imported into a packet analyzer such as Wireshark for further troubleshooting and analysis.
Step1: Collect the ID of the Tier0 Uplink Interface
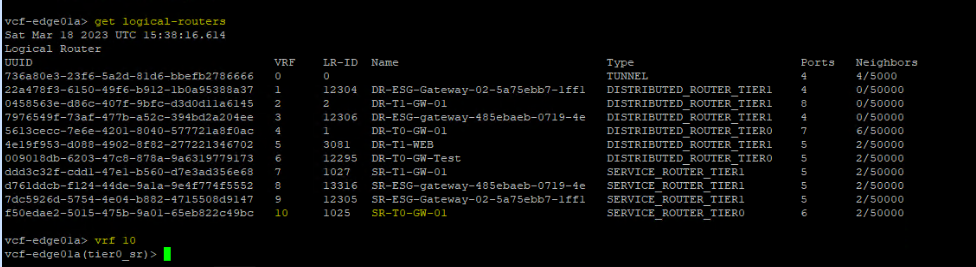
First you have to SSH to the NSX-T edge node running the active SR using admin credentials, then switch the context to the VRF corresponding to the Tier0 SR:
vcf-edge01a> get logical-routers
vcf-edge01a> vrf <vrf_Number>
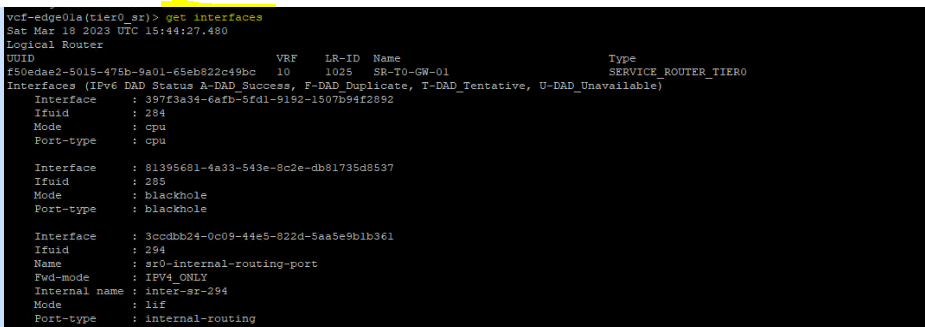
Now you are in the right context, you need to identify the ID of the Tier0 SR uplink interface.
vcf-edge01a(tier0_sr)> get interfaces
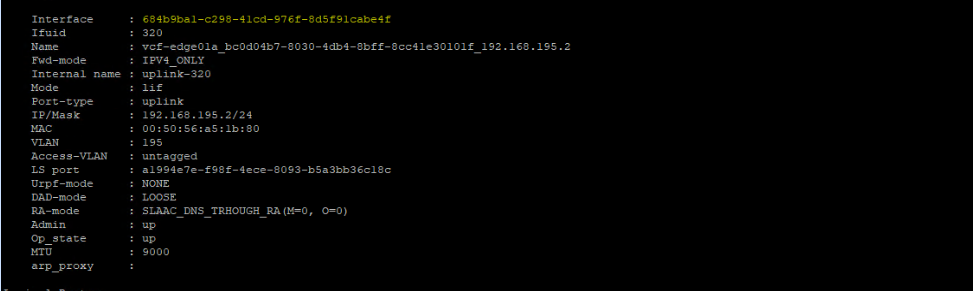
The Tier0 SR uplink interface ID is: 684b9ba1-c298-41cd-976f-8d5f91cabe4f
This is the interface where you will capture the incoming & outgoing traffic.
Step2: Define and Start Capture Session
Next you need to define a new capture session, interface (the ID that we collected at step1) and direction of traffic (dual means both incoming and outgoing traffic) that you want to trace. Note that before running the below command, you have to exit the VRF mode:
vcf-edge01a(tier0_sr)> exit
vcf-edge01a> set capture session 1 interface 684b9ba1-c298-41cd-976f-8d5f91cabe4f direction dual

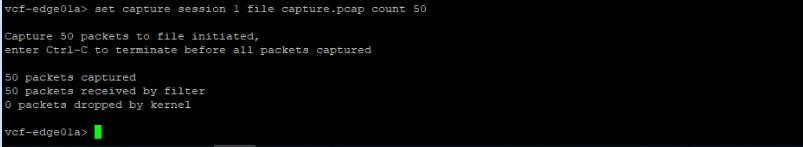
Let’s start the capture session now by capturing 50 packets and save them into a .pcap file:
vcf-edge01a> set capture session 1 file capture.pcap count 50
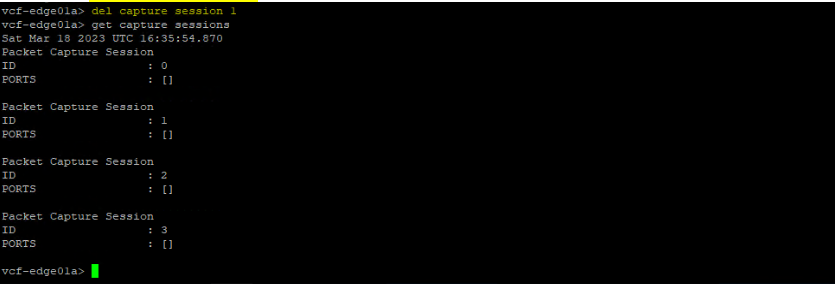
The capture is done successfully. Let’s delete the capture session and make sure no capture sessions are running on the NSX-T edge node.
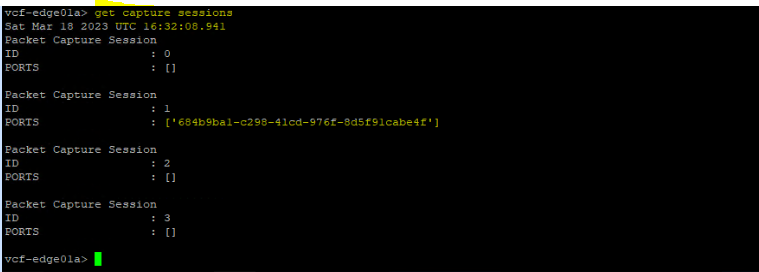
To check the current running capture sessions:
vcf-edge01a> get capture sessions
Let’s delete the capture session “1” that we created.
vcf-edge01a> del capture session 1
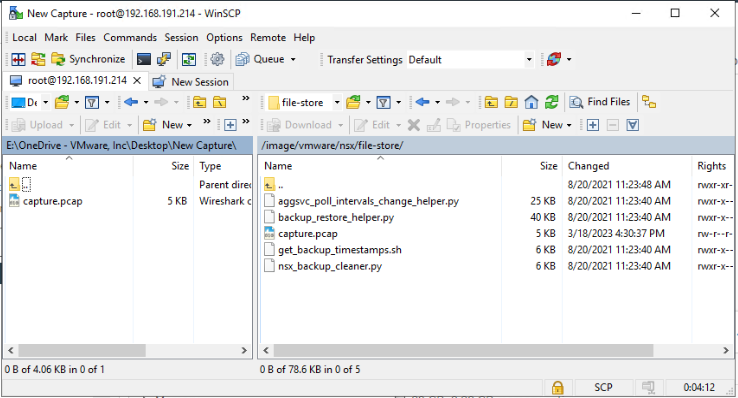
Step3: Copy the PCAP file and analyze it
By default, the generated PCAP file will be stored in the following directory on the NSX-T edge node:
/image/vmware/nsx/file-store/
You can use WinSCP to connect to the edge node and copy the .pcap file to your machine.
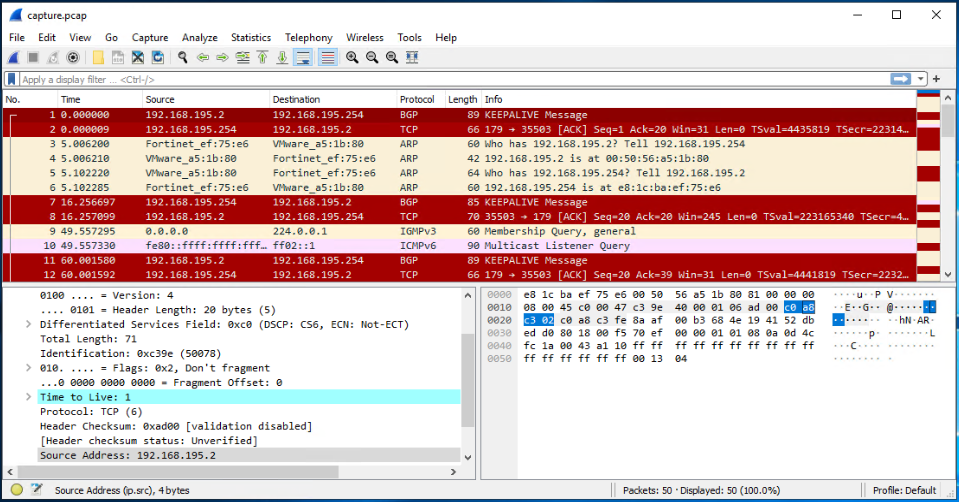
Finally, you can open the pcap file using WireShark and analyze it.
I hope this post was informative,
Thanks for reading,
 (2 votes, average: 5.00 out of 5)
2 thoughts
Comments are closed.