I have written a previous post on how to capture traffic on Tier0 gateway uplink in NSX 3.x via CLI.
However, and as per the release of NSX 4.0.0.1, you can use the Live Traffic Analysis tool to perform packet capture on NSX Edge interfaces via the NSX Manager UI portal.
https://docs.vmware.com/en/VMware-NSX/4.0/rn/vmware-nsx-4001-release-notes/index.html
In this post, I will guide you through the steps to use “Live Traffic Analysis Tool” from the NSX Manager User Interface (UI) to capture packets from the uplink interface of an NSX edge.
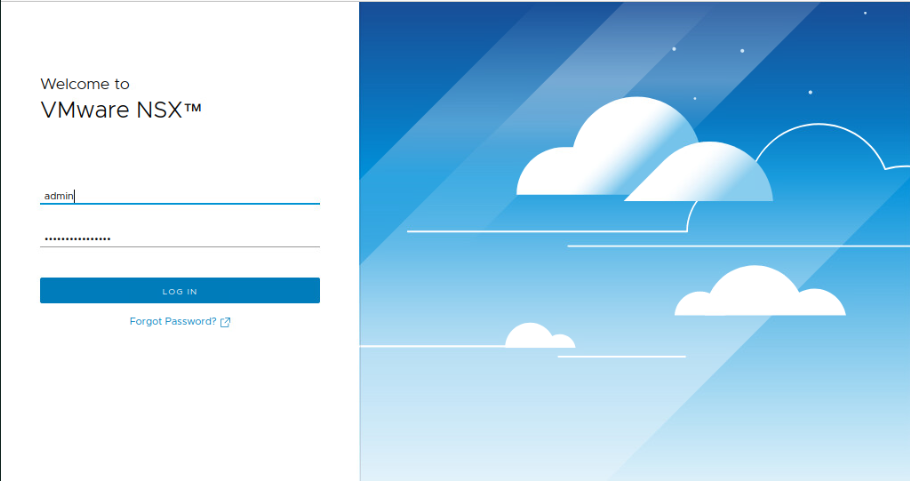
Step1: Login to NSX Manager UI
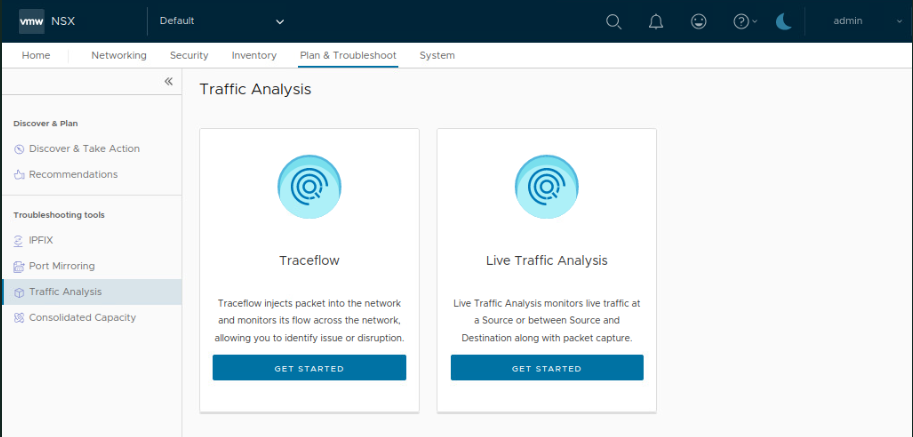
Step2: Navigate to Plan & Troubleshoot tab, then select Traffic Analysis under Troubleshooting Tools. After that click on GET STARTED under Live Traffic Analysis.
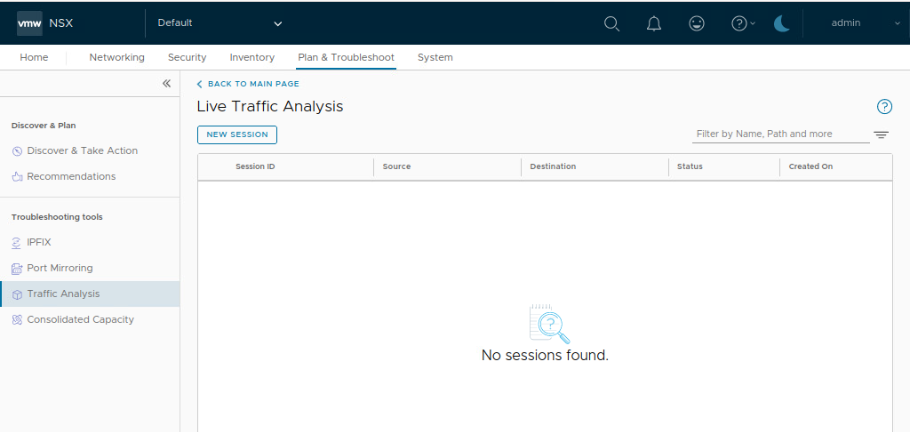
Step3: Click on New Session.
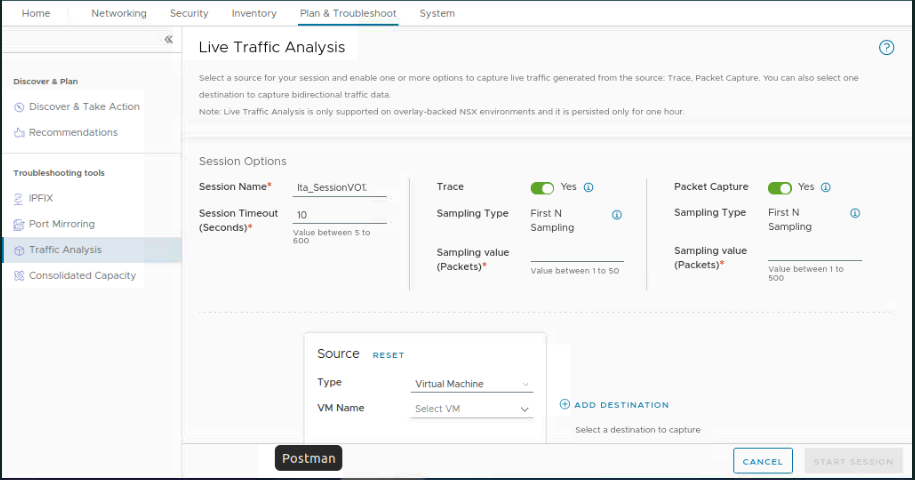
Step4: Select the Type as Port/Interface, with Attachment as the Edge Uplink, and then select the Port which is the Tier0 Gateway Uplink, and the number of packets to be captured then click on START SESSION.
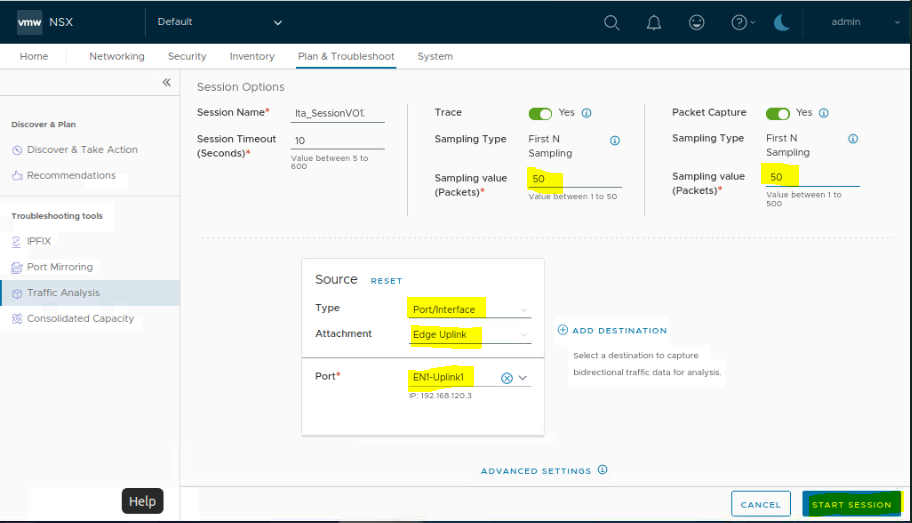
You can add a destination as well to capture bidirectional traffic for analysis.
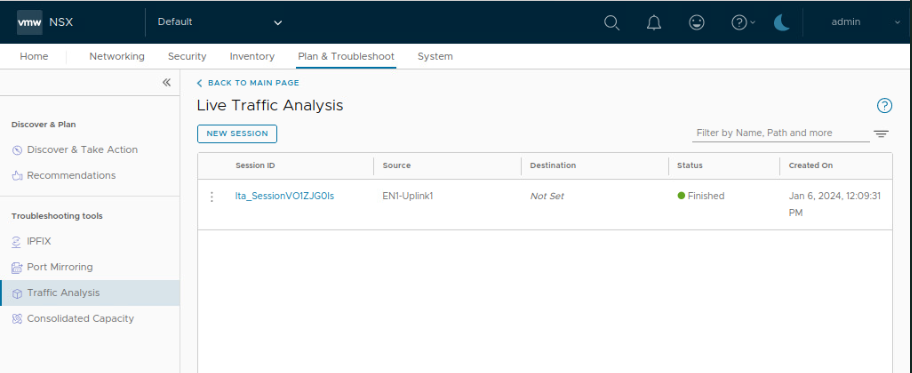
Wait for the session to be completed. The status will change from In Progress to Finished.
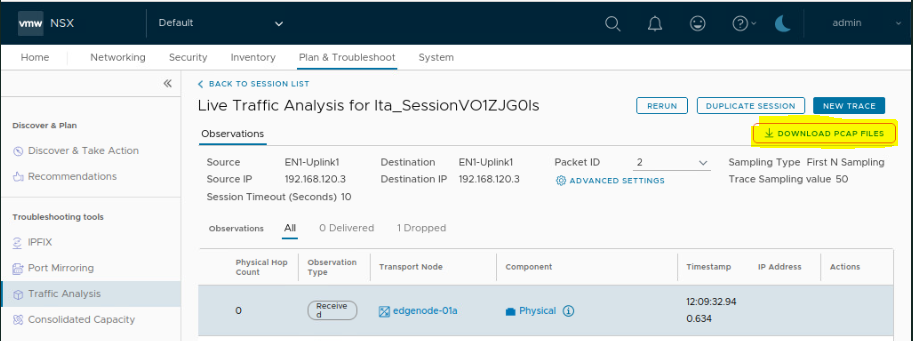
Step5: Click on the Session ID, then you can download the pcap file to be analyzed by Wireshark.
Hope this post is informative,
Thanks for reading,

 (1 votes, average: 4.00 out of 5)